
Variable Analysis
Plot and compare historical data for one or more variables on an interactive, time-based chart. Select any combination of device variables and a time range to spot trends, compare readings side by side, and inspect exact values at specific points in time.
Generating an Analysis
Section titled “Generating an Analysis”- In the top navigation bar, select Devices.
- From the dropdown, select Variable Analysis.
- Select Select Variables in the top-right corner.
- Under Variables, search for and select the variables you want to analyze.
- Under Time Range, select from the list of preset durations, or select Custom to set an exact start and end date and time.
- Select Apply Filter.
The chart displays the selected variables as separate lines, plotted against time. Hover over the chart to view exact values for each variable at a given timestamp.
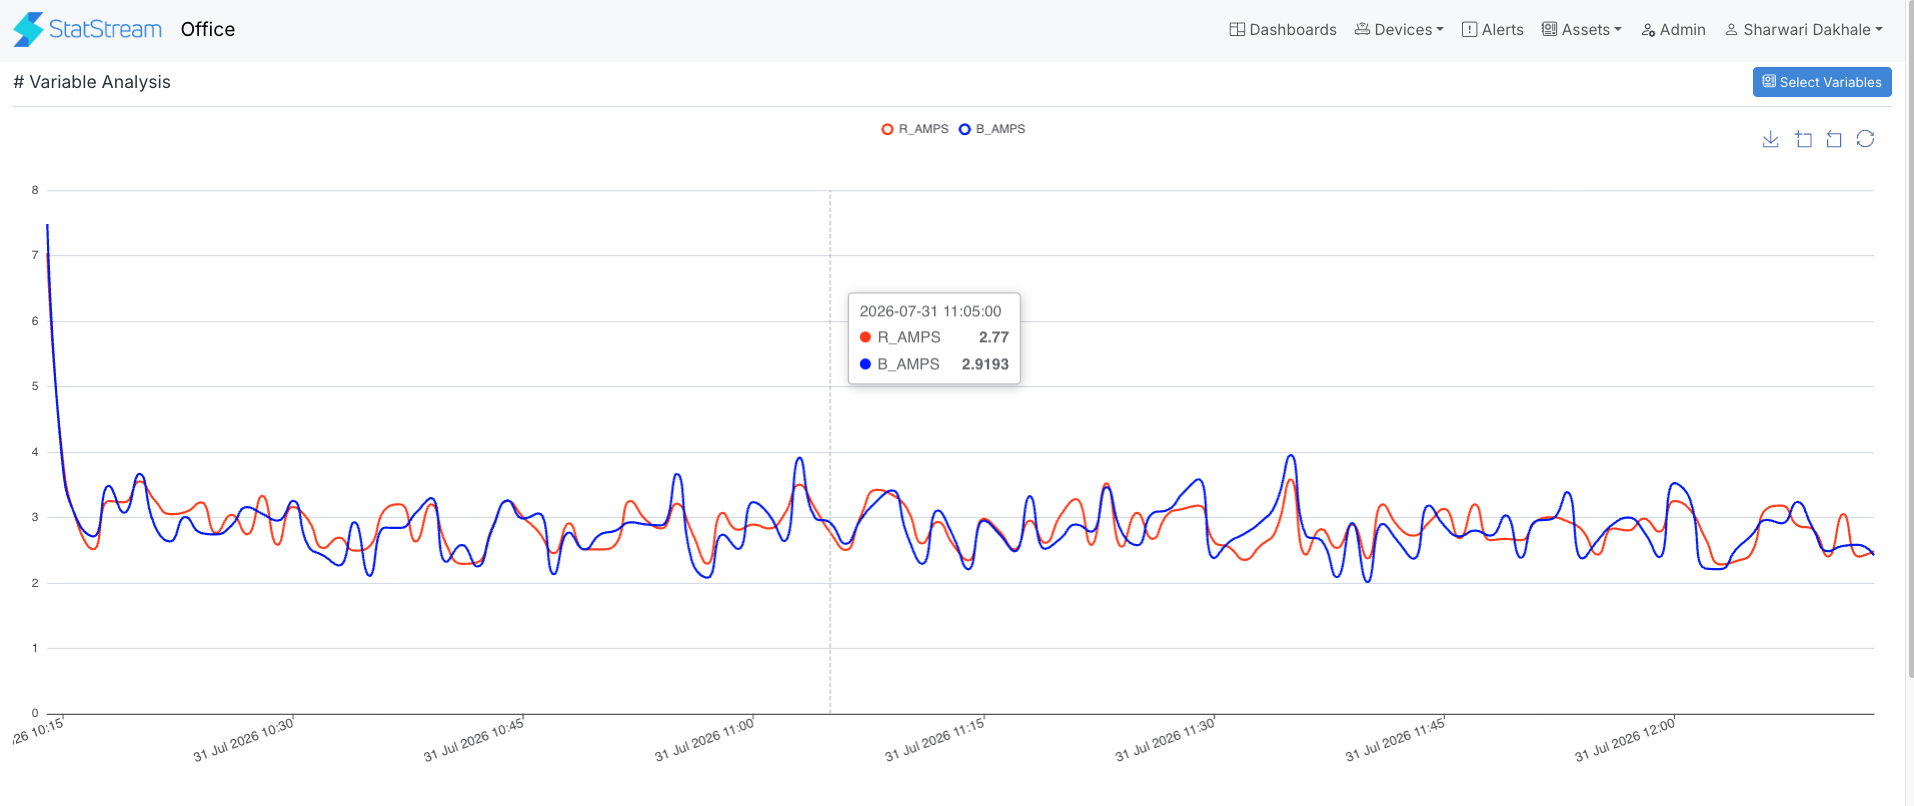
Chart Controls
Section titled “Chart Controls”The chart toolbar, in the top-right corner, provides the following options:
| Control | Description |
|---|---|
| Download | Download the chart as an image. |
| Zoom | Select an area on the chart to zoom in. |
| Reset Zoom | Reset the chart to its default zoom level. |
| Reset | Reset the chart view. |