
Overview
Dashboards help you monitor, analyze, and visualize operational and energy data through configurable widgets. They combine real-time and historical information into a single view, making it easier to track performance and identify trends.
Accessing Dashboard Management
Section titled “Accessing Dashboard Management”To create or manage dashboards:
- Click Admin from the top navigation bar.
- select Dashboards from the left sidebar.
The Manage Dashboards page displays all dashboards available in the current workspace.
Creating a Dashboard
Section titled “Creating a Dashboard”Click New Dashboard and provide the following information:
| Field | Description |
|---|---|
| Dashboard Name | A unique name used to identify the dashboard. |
| Description | Brief description of the dashboard’s purpose. |
| Teams | Optional. Assign up to five teams that can access the dashboard. Users with the Dashboard Viewer role can only view dashboards assigned to their teams. |
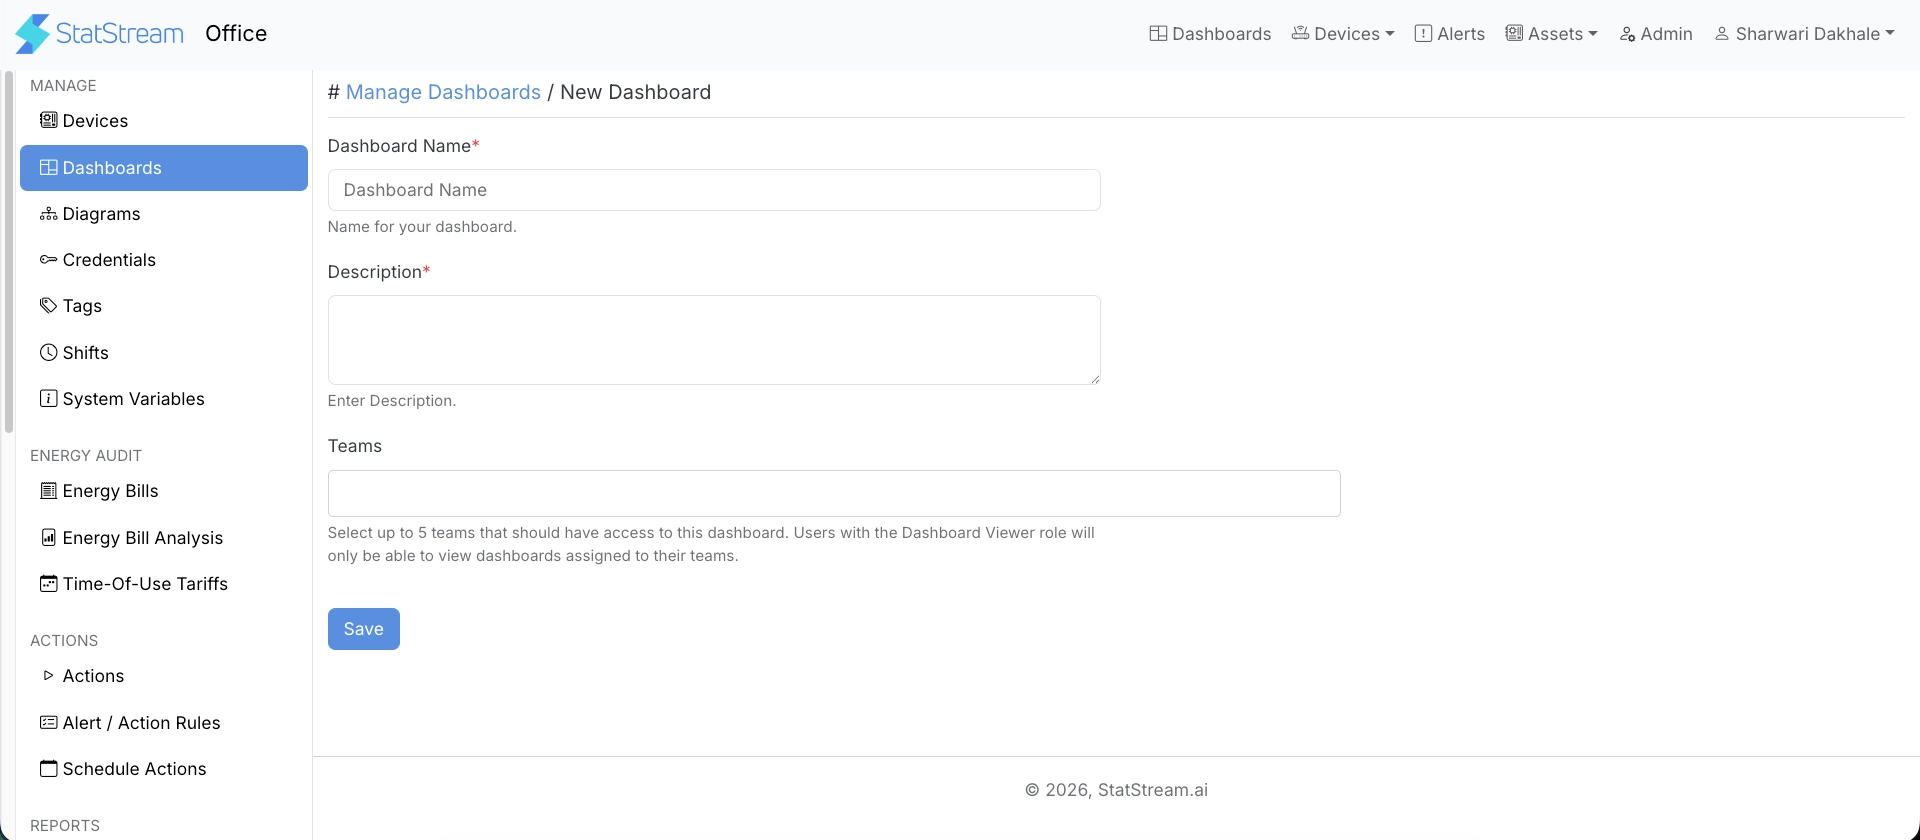
After saving the dashboard, you can begin adding widgets to visualize your data.
Organizing Dashboards
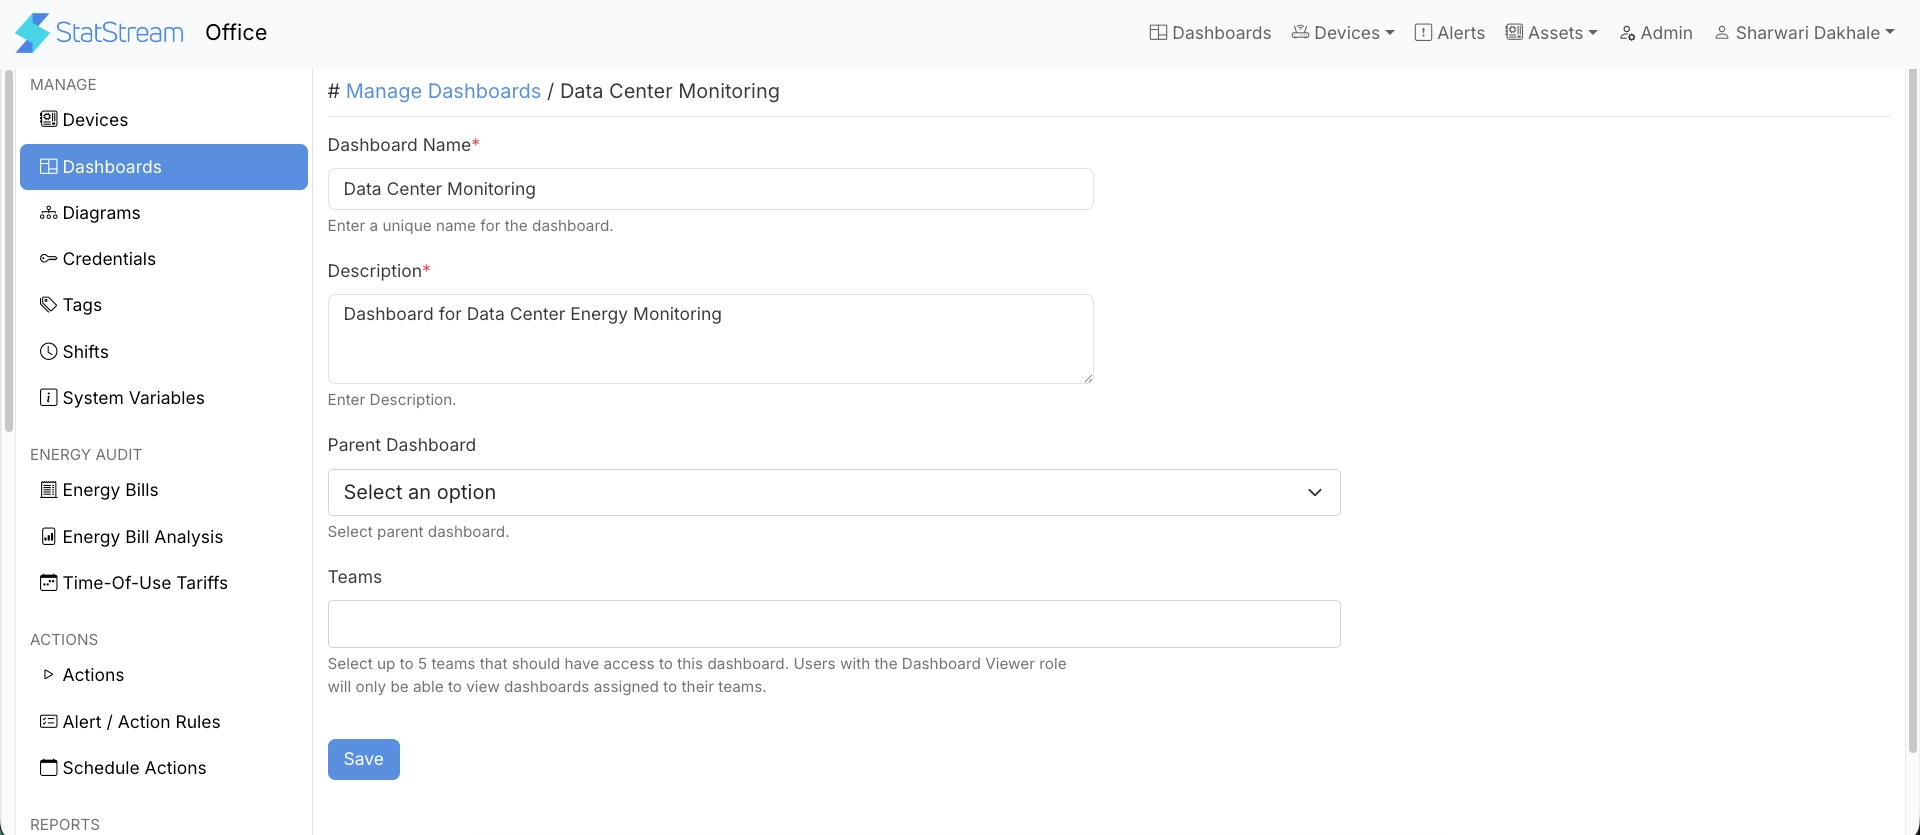
Section titled “Organizing Dashboards”Related dashboards can be organized into a hierarchical structure using Parent Dashboards. This makes it easier to group dashboards and simplify navigation, especially in workspaces with multiple dashboards.
To assign a parent dashboard:
- Navigate to Admin → Dashboards.
- Click Edit for the required dashboard.
- Select the required Parent Dashboard.
- Save the changes.
| Field | Description |
|---|---|
| Parent Dashboard | Optional. Select a parent dashboard to organize related dashboards into a hierarchical structure. |
Viewing Dashboards
Section titled “Viewing Dashboards”To open a dashboard:
- Click Dashboards from the top navigation bar.
- Select the required dashboard from the dashboard selector.
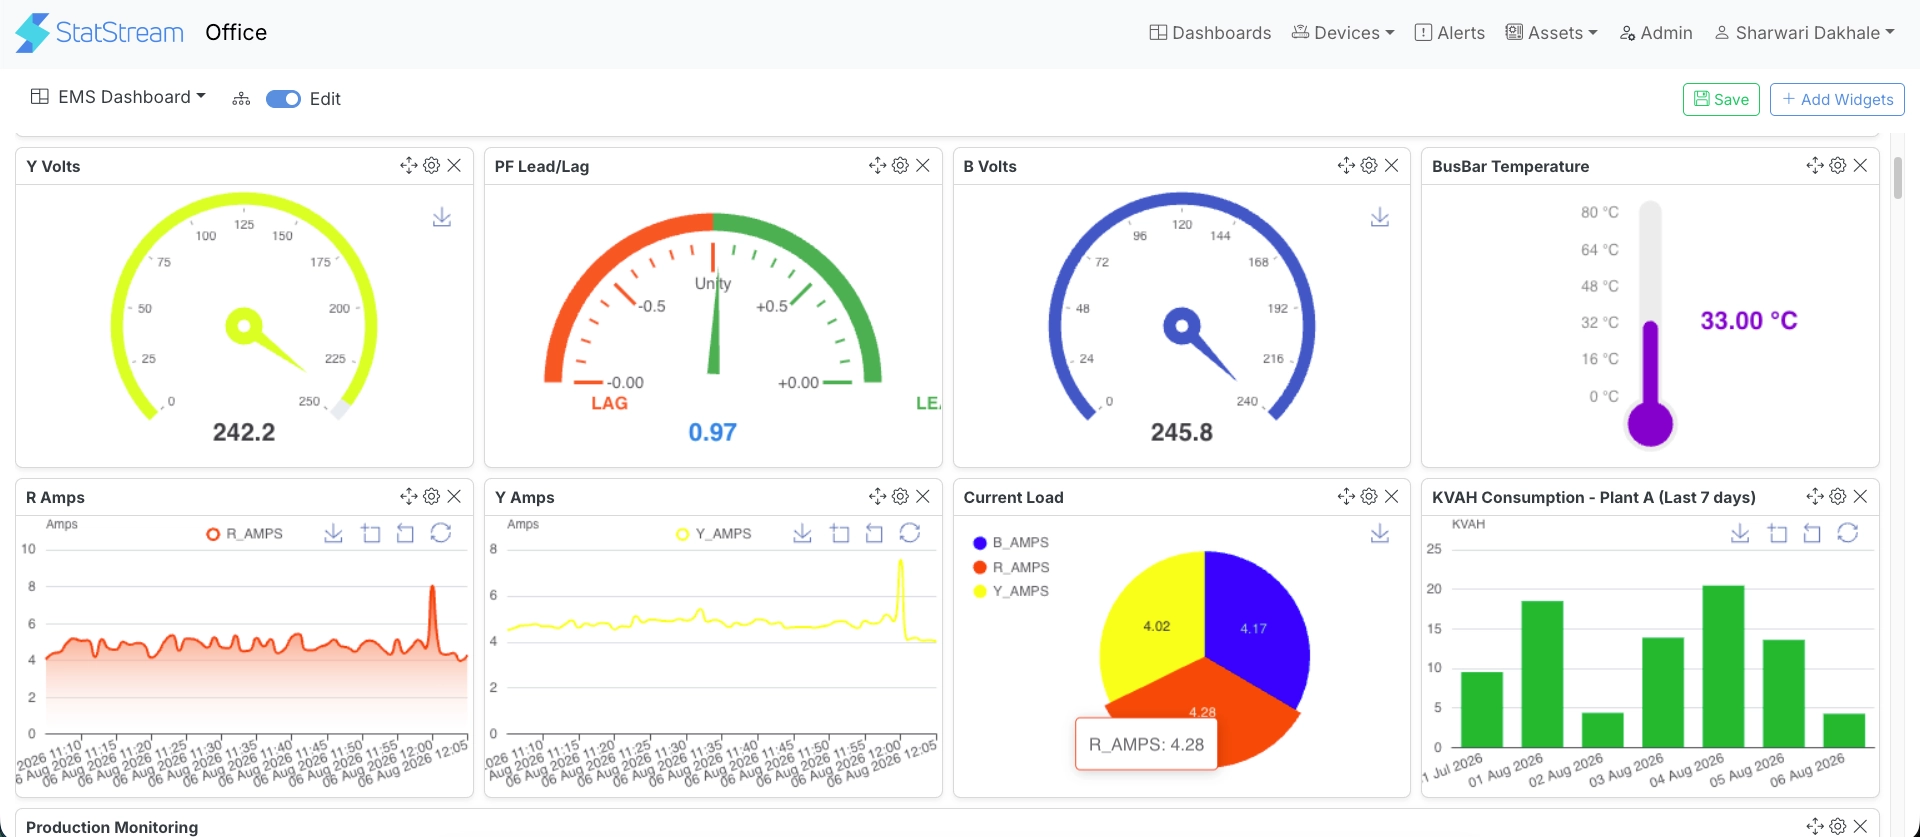
While viewing a dashboard, you can:
- Select a time range to display live or historical data.
- Apply filters to refine the displayed information.
- View the last updated timestamp for individual widgets.
Editing Dashboard Layout
Section titled “Editing Dashboard Layout”To modify a dashboard, open it and enable Edit mode. You can then:
- Add widgets.
- Reposition and resize widgets.
- Configure widget settings.
- Remove widgets.
- Save the updated layout.
Widgets
Section titled “Widgets”Widgets are the building blocks of a dashboard, allowing you to visualize different types of operational, energy, and analytical data.
For detailed information about the available widget types and their configuration, see the Widgets section.