
Asset Based Dashboard
The Asset Based Dashboard provides a real-time view of an individual asset by displaying widgets for the variables linked to that asset.
Each asset in StatStream represents a unique Asset Tag. When one or more variables are linked to an asset, the dashboard automatically displays widgets to visualize their data. This enables users to monitor asset performance, analyze operational metrics, and track asset behavior from a single dashboard.
View an Asset Dashboard
Section titled “View an Asset Dashboard”Follow these steps to open the dashboard for a specific asset:
- Navigate to Assets from the top navigation bar.
- Select Assets.
- Locate the asset whose dashboard you want to view.
- Click Dashboard from the Actions column.
Asset List
Section titled “Asset List”
After selecting an asset, the Asset Based Dashboard opens and displays widgets for all variables linked to that asset.
Asset Dashboard
Section titled “Asset Dashboard”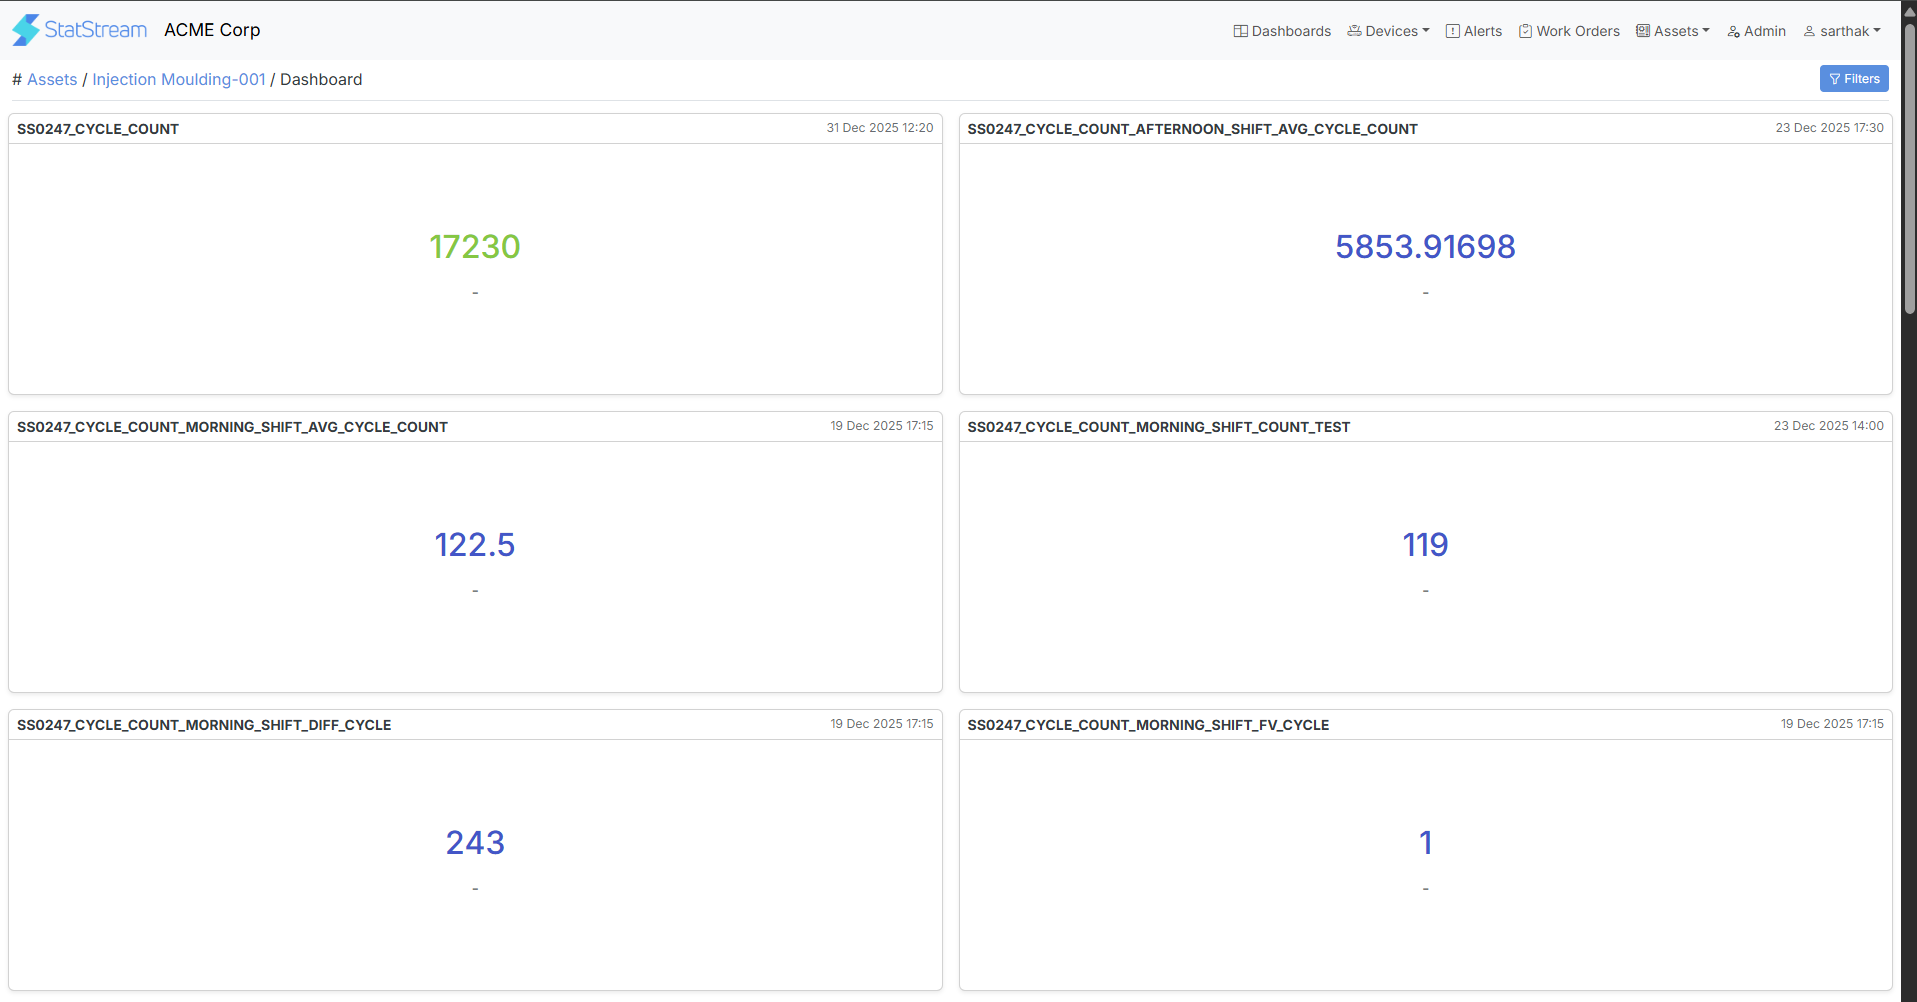
How the Dashboard Works
Section titled “How the Dashboard Works”The Asset-Based Dashboard displays widgets based on the variables associated with the selected asset.
Workflow
Section titled “Workflow”-
When an asset is created, StatStream automatically generates a unique system tag using the following format:
sys_asset_<asset_tag>Example:
- Asset Tag:
pump_01 - Generated Tag:
sys_asset_pump_01
- Asset Tag:
-
Variables can be associated with the asset by assigning them the generated system tag.
-
When the Asset-Based Dashboard is opened, it retrieves all variables associated with the asset’s system tag.
-
A widget is automatically generated for each associated variable, allowing you to monitor the asset’s operational data in real time.
Note
Variables: Dashboard widgets are generated only for variables associated with the asset’s generated system tag.
Filters: Use the Filters button to refine the displayed data and focus on the information relevant to your analysis.