
Overview
Widgets are the core building blocks of a StatStream dashboard. Each widget is designed to visualize a specific aspect of your operational or energy data, enabling you to monitor system performance, analyze historical trends, control connected devices, and gain actionable insights from a single dashboard.
A dashboard can contain multiple widgets of different types, allowing you to create customized views for specific plants, processes, assets, or operational requirements.
Adding Widgets
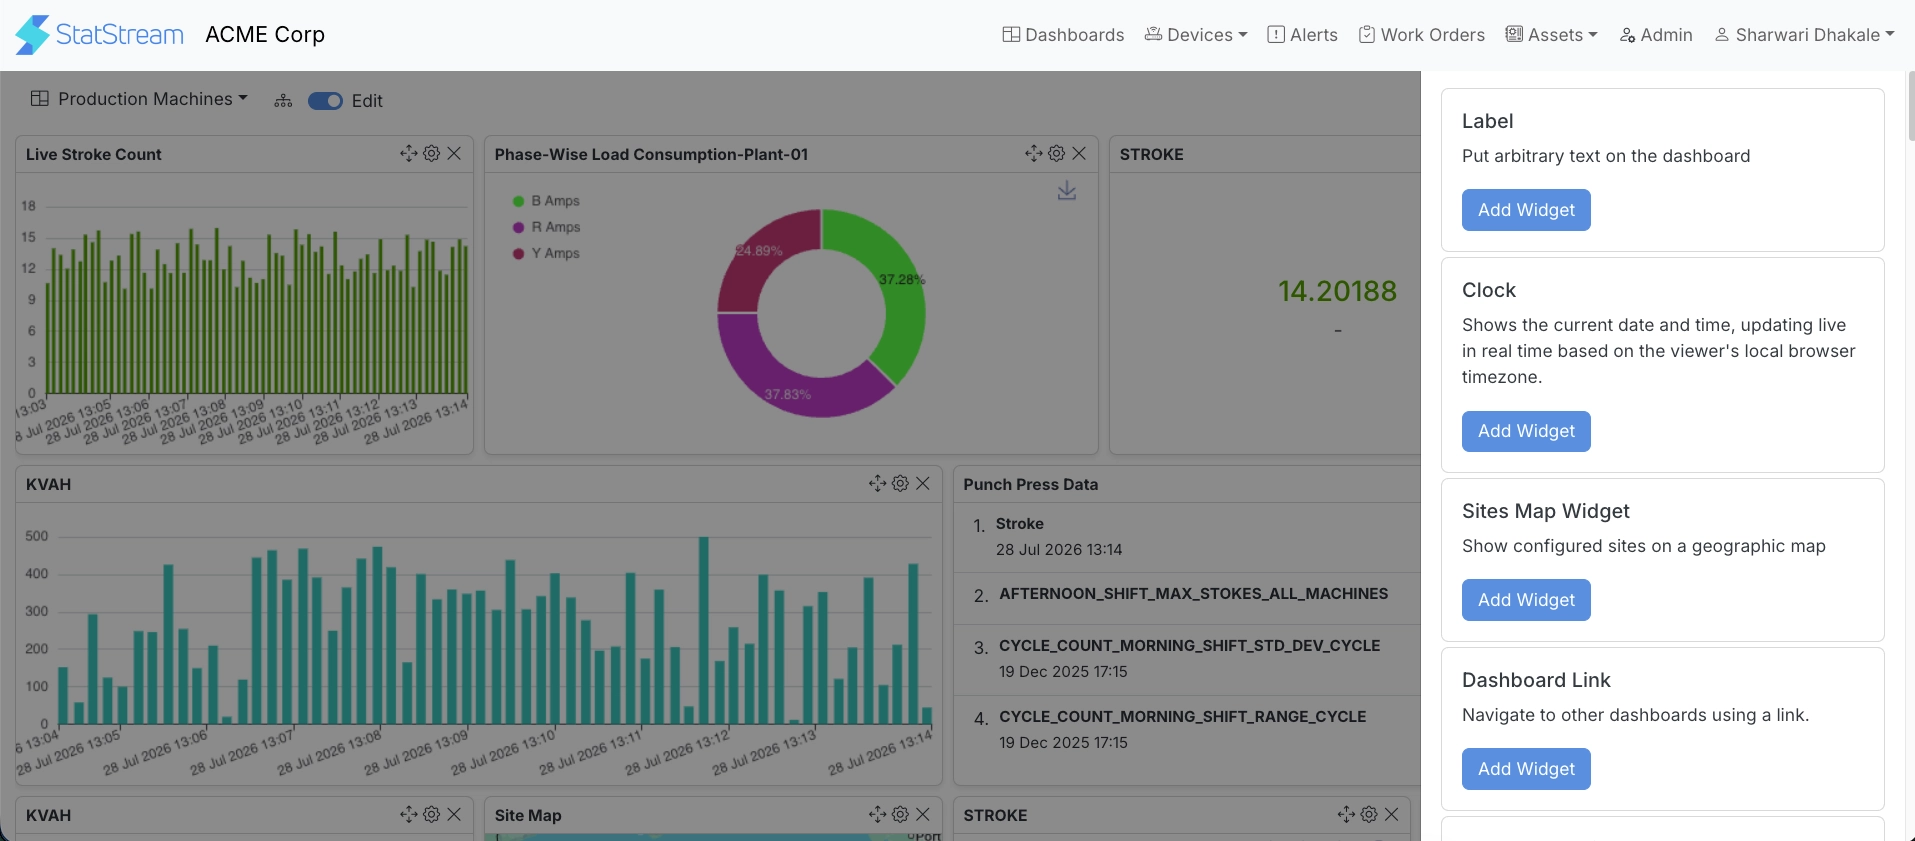
Section titled “Adding Widgets”To add widgets to a dashboard:
- Open the required dashboard.
- Enable Edit mode.
- Select the desired widget from the widget panel.
- Configure the widget settings and save your changes.
Common Widget Properties
Section titled “Common Widget Properties”While each widget provides its own configuration options, the following properties are available across all widget types.
| Property | Description |
|---|---|
| Title | Specifies the display title shown on the widget. |
| Horizontal Size | Determines the width of the widget within the dashboard layout. |
Additional properties are specific to each widget and are documented in their respective sections.
Widget Library
Section titled “Widget Library”Detailed documentation for each widget is available in the following sections.