
Energy & Analytics Widgets
These widgets go beyond raw data display — surfacing AI-generated recommendations and Time-of-Use (TOU) cost analysis to help you understand and optimize energy spend.
AI Recommendations Widget
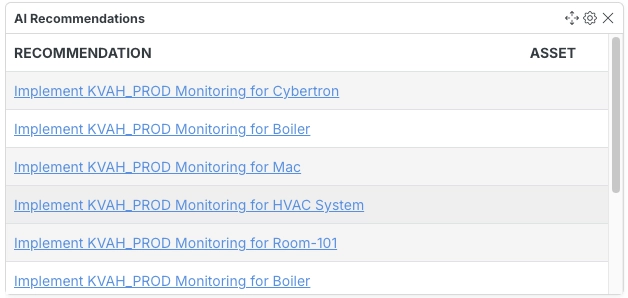
Section titled “AI Recommendations Widget”Displays the top 10 critical AI-generated recommendations across assets.
Configuration
Section titled “Configuration”No additional fields — just Horizontal Size and Title.
- Recommendations are generated per asset — open an asset’s info page and click AI Analysis to generate recommendations for that asset.
- This widget aggregates recommendations across all assets in the workspace and surfaces the top 10 most critical ones; no manual selection needed on the widget itself.
- If few or no assets have been analyzed yet, the widget will show correspondingly few or no recommendations — run AI Analysis on your key assets first to populate it.
TOU Charges Forecast
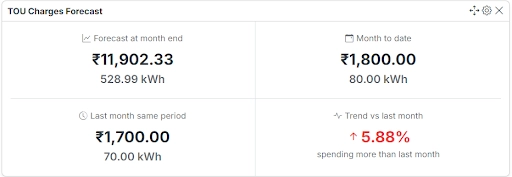
Section titled “TOU Charges Forecast”Displays the forecasted Time-of-Use (TOU) charges for the current month, shows month-to-date charges, comparison with the same period last month, and the overall trend.
Configuration
Section titled “Configuration”| Field | Description |
|---|---|
| Variable ID | Select the TOU charge variable representing the calculated cost of electricity for Time-of-Use slots (for example: <variable>_SLOT_CHARGE). |
- Displays the forecasted total cost for the current month, month-to-date charges and consumption, the same period charges from the previous month, and the percentage trend indicating whether costs are increasing or decreasing.
TOU Charges Summary
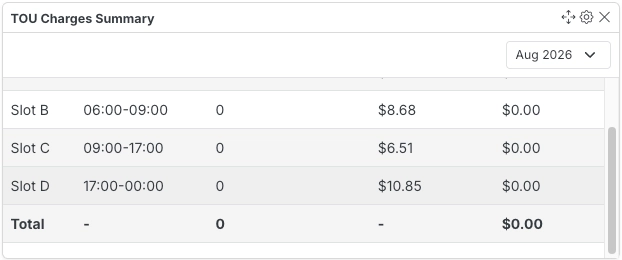
Section titled “TOU Charges Summary”Displays summary of Time-of-Use (TOU) charges for the selected season and time period.
Configuration
Section titled “Configuration”No additional fields — just Horizontal Size and Title.
TOU Charges by Slots (Month-till-Date)
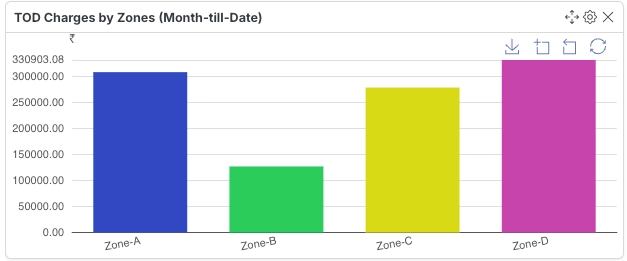
Section titled “TOU Charges by Slots (Month-till-Date)”Displays a bar chart of total Time-of-Use (TOU) electricity charges for each month based on the selected TOU season.
Configuration
Section titled “Configuration”| Field | Description |
|---|---|
| TOU Season | Select the Time-of-Use (TOU) tariff season whose slots will be analyzed. |
- Displays a Month-to-Date breakdown of electricity charges calculated using TOU tariffs. Each bar represents the total cost accumulated for a specific tariff slot (for example: Peak, Off-Peak, or Normal) from the first day of the current month up to the current time.
- Charges are computed by multiplying the energy consumption of all variables tagged as electrical units (
sys_electrical_unit) with the slot’s per-unit tariff price.
TOU Consumption vs Charges by Slots (Month-to-Date)
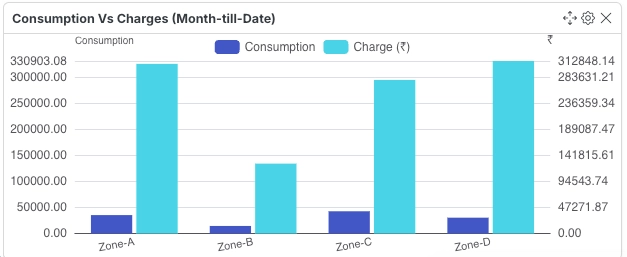
Section titled “TOU Consumption vs Charges by Slots (Month-to-Date)”Displays a dual-axis bar chart comparing electricity consumption and corresponding Time-of-Use (TOU) charges for each tariff slot during the current month.
Configuration
Section titled “Configuration”| Field | Description |
|---|---|
| TOU Season | Select the Time-of-Use (TOU) tariff season whose slots will be analyzed. |
- The widget aggregates electricity consumption from all variables tagged as electrical units and calculates the corresponding charges for each slot from the beginning of the current month until now.
- Consumption and charges are plotted on separate axes, useful for spotting slots where high consumption doesn’t necessarily mean the highest cost (or vice versa).