
Device Dashboard
View real-time and historical values for a device’s variables as configurable widgets, letting you monitor a device’s status at a glance.
Accessing the Dashboard
Section titled “Accessing the Dashboard”- In the top navigation bar, select Devices.
- From the dropdown, select Devices.
- Select Dashboard next to the device you want to view.
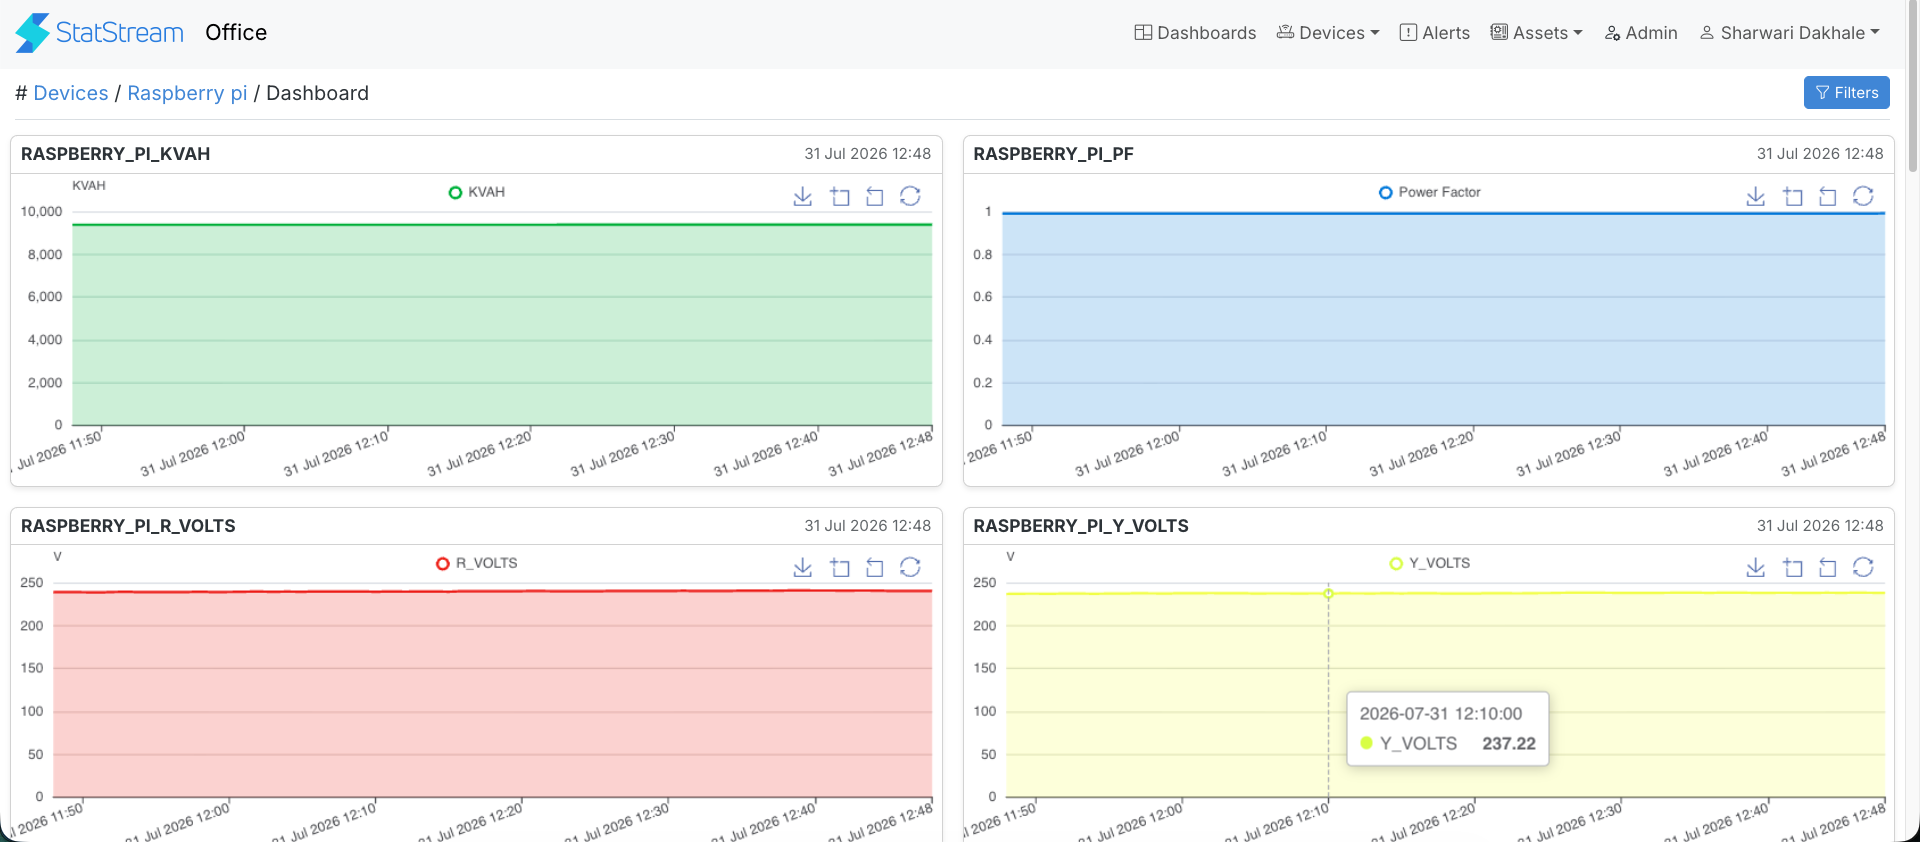
Each of the device’s variables is displayed as a widget, showing the latest value and the timestamp it was last updated.
Filtering the Dashboard
Section titled “Filtering the Dashboard”Select Filters in the top-right corner to customize which variables are shown and how.
| Filter | Description |
|---|---|
| Variables | Search for and select the variables to display. |
| Widget Type | Choose how each variable is visualized: Value, Line, Bar, or List. |
| Time Range | Choose the data window for the widgets: Live, a predefined range from Last 1 Hour up to Last 1 Week, or Custom to specify a start and end date and time. |
Select Apply Filter to update the dashboard with your selections.