What's New in StatStream
Every release ships real improvements. Here's what we've been building.
v2.8.0 — Power Factor Widgets & Value Card Enhancements
This release introduces new Power Factor widgets and enhances the Value Card widget to improve real-time data visualization.
Power Factor Line Widget
- Visualize power factor trends over time using a line chart
- Unity positioned at the center, clearly separating Lead and Lag regions
- Color-coded regions for intuitive interpretation of power factor behavior
- Supports real-time updates via WebSocket for live trend monitoring
Power Factor Gauge Widget
- Gauge-style visualization displaying the current power factor value
- Clear Lead and Lag indication for quick operational awareness
- Dynamic pointer movement reflecting the latest value
- Real-time updates via WebSocket
- Available only for variables tagged with
sys_power_factor
Value Card Widget Enhancements
- Conditional value coloring based on configurable conditions
- Supports comparison operators:
==,>,<,>=,<= - Configure up to 5 conditions per widget
- Conditions are automatically re-evaluated during live WebSocket updates
v2.7.1 — UI Improvement
This update introduces a UI enhancement to improve consistency and usability across the platform.
Edit Action UI Update
- Replaced Edit Form navigation links with buttons in list tables across all screens.
- This change improves visual consistency, accessibility, and user experience while interacting with list views.
v2.7.0 — Industrial Energy Intelligence: TOD/TOU Tariff Management
We are thrilled to introduce our TOD/TOU Energy Management feature, designed to help industries manage energy usage more effectively. In industrial environments, energy is not just a utility but a significant cost, and its price varies depending on the time of use.
This feature closes the “visibility gap” by enabling industries to map production schedules against complex utility tariff structures. It also provides automatic real-time financial tracking, helping eliminate end-of-month billing surprises and protect profit margins.
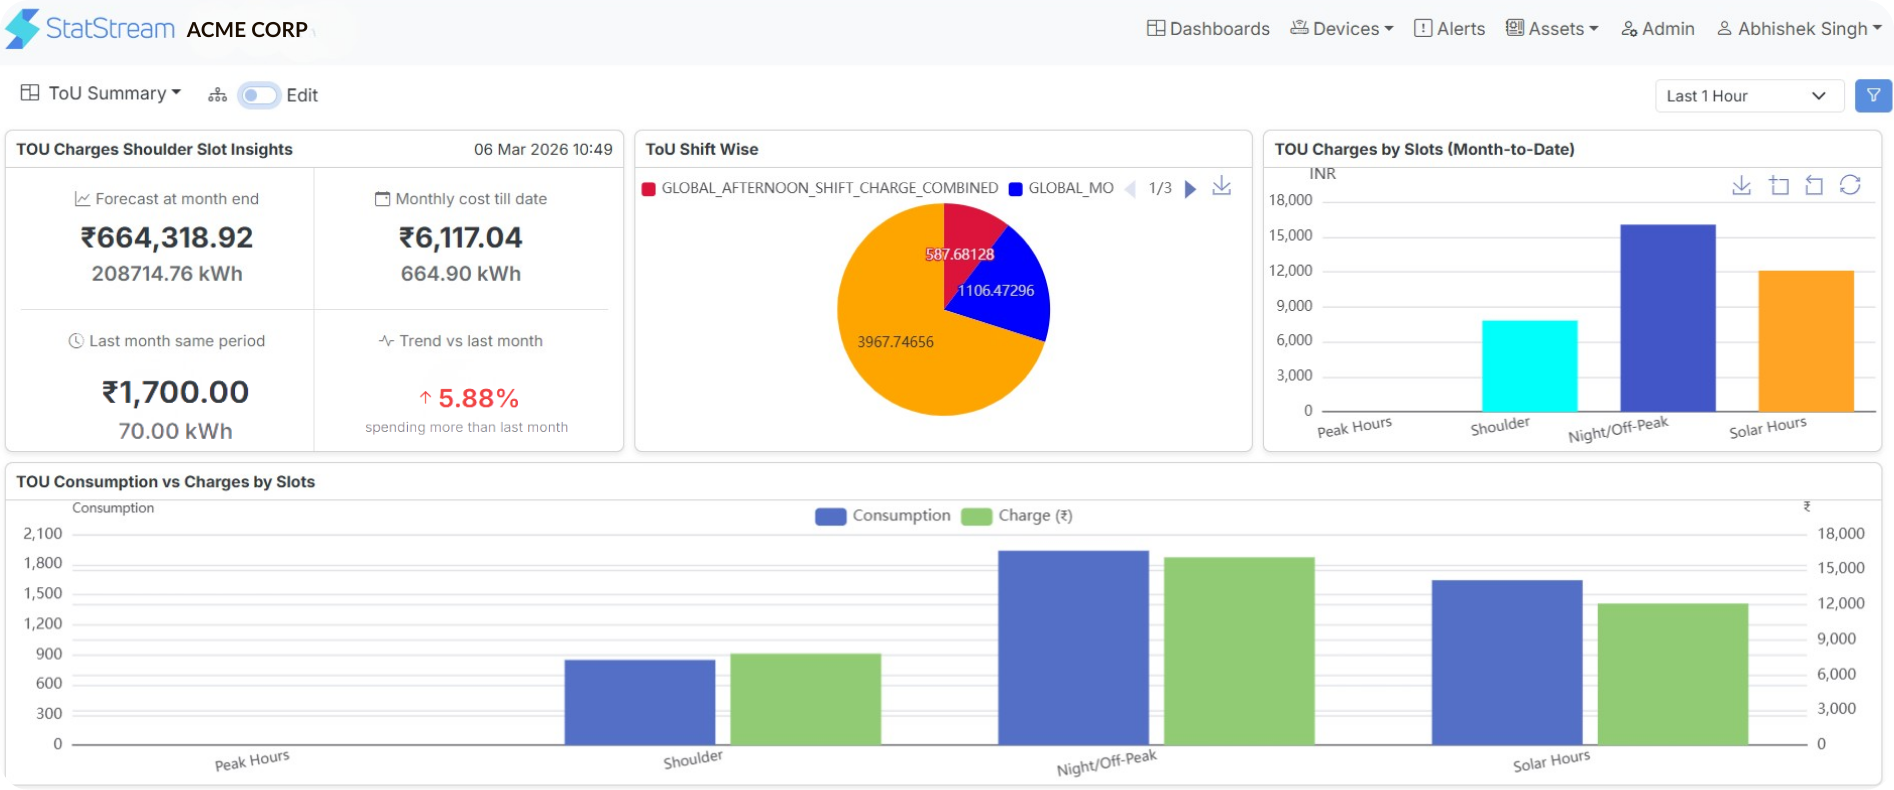
What’s New
Season-Based TOD/TOU Tariff Configuration
-
Configuration Engine
- Configure tariff periods using Summer, Winter, or Shoulder seasons.
-
Multiple TOD/TOU Slot Configurations
-
Define multiple tariff slots within a selected season with the following options:
-
Cost Category – Define High, Medium, or Low cost slots.
-
Time Range – Specify start and end times for each slot.
-
Active Days – Configure weekdays, weekends, or operational shifts as active days.
-
Tariff Rates – Assign specific tariffs (per unit) for each slot.
-
This flexible configuration engine allows industries to accurately represent complex utility tariff structures.
Intelligent TOD/TOU Dashboard Widgets
We’ve introduced four powerful widgets that transform raw electrical data into actionable financial insights.
Forecast By Month-End Charge (TOD/TOU)
- Predict your expected energy bill for the month
- Uses rolling 5-day analysis
- Compare against previous months and historical trends
Summary of Charges (TOD/TOU)
- Get a clear breakdown of energy costs
- View charges grouped by season and tariff period
TOD/TOU Charge (Bar Chart)
- Visualize how your energy costs are distributed across:
- Peak periods
- Off-Peak periods
- Shoulder periods
Dual Axis Chart
- Analyze the relationship between energy consumption and tariff cost
- Understand how usage patterns influence production expenses
Why This Matters
Managing industrial energy without TOD/TOU visibility is like running operations with a 30-day delay — you only discover the cost impact when the bill arrives.
With this release, StatStream enables you to:
- Identify the “Peak Hour Tax” – Discover exactly when production becomes most expensive
- Optimize production schedules based on energy pricing
- Improve energy accountability across teams and shifts
- Monitor financial impact in real time instead of waiting for monthly bills
- Automate complex energy cost analysis with intelligent insights
This update brings energy usage, tariff structures, and financial impact together in one place, helping industries make smarter operational decisions and reduce unexpected energy costs.
v2.6.1 — Visualization Improvements
This update includes enhancements to improve dashboard clarity and visual consistency.
Improvements
- List Widget Enhancement – Variable values are now displayed using their respective variable colors, improving visual distinction and dashboard readability.
v2.6.0 — Thermometer Widget
This release introduces the Thermometer Widget for intuitive temperature visualization and includes enhancements to improve dashboard clarity and consistency.
Thermometer Widget
- Visualize temperature-based variables using a thermometer-style indicator
- Configure minimum and maximum thresholds to define the measurement range
- Monitor real-time values within the configured limits
- Easily compare current values against defined boundaries
- Dynamic mercury level adjustment based on incoming values within the configured range
Want to be notified about new releases?
Get Started with StatStream